In this Microsoft .NET blog post, we will show how to configure a debugger in the VS Code IDE for a .NET (C#) application.
Debugging an application using a proper debugger can unveil runtime issues that are not detectable just by using Console.WriteLine("value") and reviewing code line by line.
VS Code and the C# Devkit extension allow us to debug applications using breakpoints and more advanced tools.
Note: Ensure you have the latest C# Devkit extension version installed.
Configuring the VS Code Debugger for .NET Applications
Before debugging our application, we need to ensure our project contains a .NET solution file containing all the files belonging to it or multiple projects.
The code below creates a new C# console application, creates a solution file, and adds the console app. If you already have an existing application, skip to line number three.
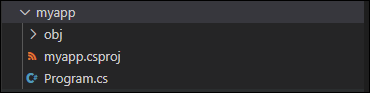
dotnet new console -o myapp
cd .\myapp\
dotnet new sln
dotnet sln add C:\Source\myapp\
Once you have a solution file in place, in VS code, do the following:
Click on the folder where the project is located
In VS Code
Click on View
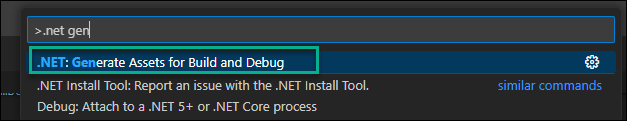
Select Command Palette
Start typing .NET generate
Click on the .NET Generate Assets…
The command will create a folder called .vscode in the root folder of the workstation folder of VS Code. To ensure the folder is created in the .NET project directory, open VS Code in the project folder only; otherwise, the folder will be created in the root folder.
The result should look like
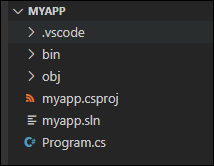
The .vscode folder contains two files that define the configuration of the debugger.
- lunch.json
- task.json
Debug Code
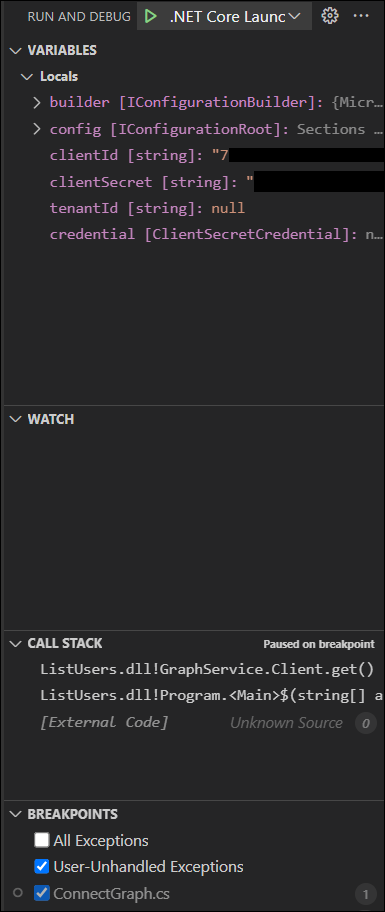
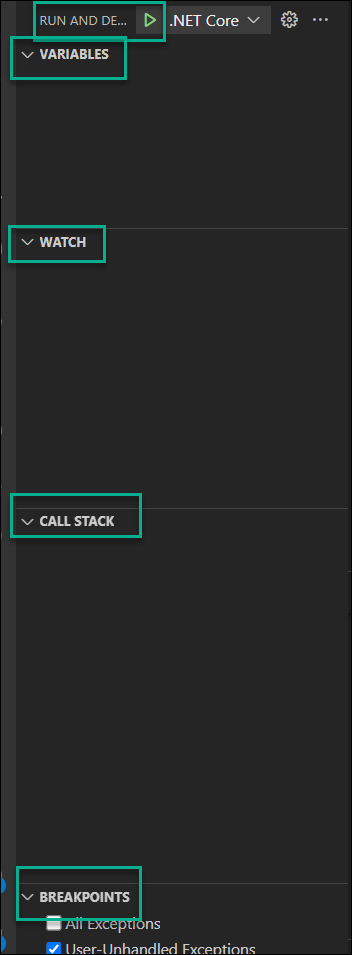
To debug a C# application and see how it’s being debugged in real time, click the RUN and DEBUG menu, VS Code.
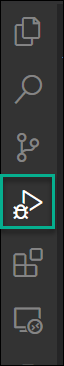
The RUN and DEBUG menu has the section you need to be aware of for the main section and can help you debug your application. The green play button starts the application in debug mode.
Create a Breakpoint and debug
The cornerstone of debugging is creating breakpoints in VS code. These breakpoints tell the debugger to stop/pause and allow you to review variable values and runtime information.
We create a breakpoint in the VS Code editor by clicking next to a line number (marking a red dot)
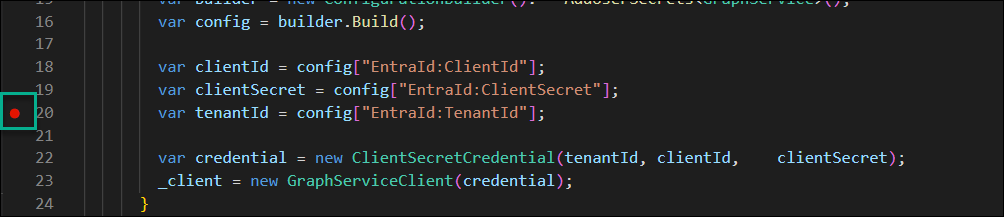
Once the red dot is set and the code runs, it will pause at the breakpoint. A code can have multiple breakpoints; you can manage them by right-clicking on the red dot.
Once you have set a breakpoint, click on the green play button and watch the RUN and DEBUG menu on the right side.